
Sports Geek: A visual tour of sporting myths, debate and data
British independent publishing house Bloomsbury Publishing partnered with author Rob Minto to share the numbers behind some of the world's biggest sports in the 2016 book, Sports Geek: A visual tour of sporting myths, debate and data.

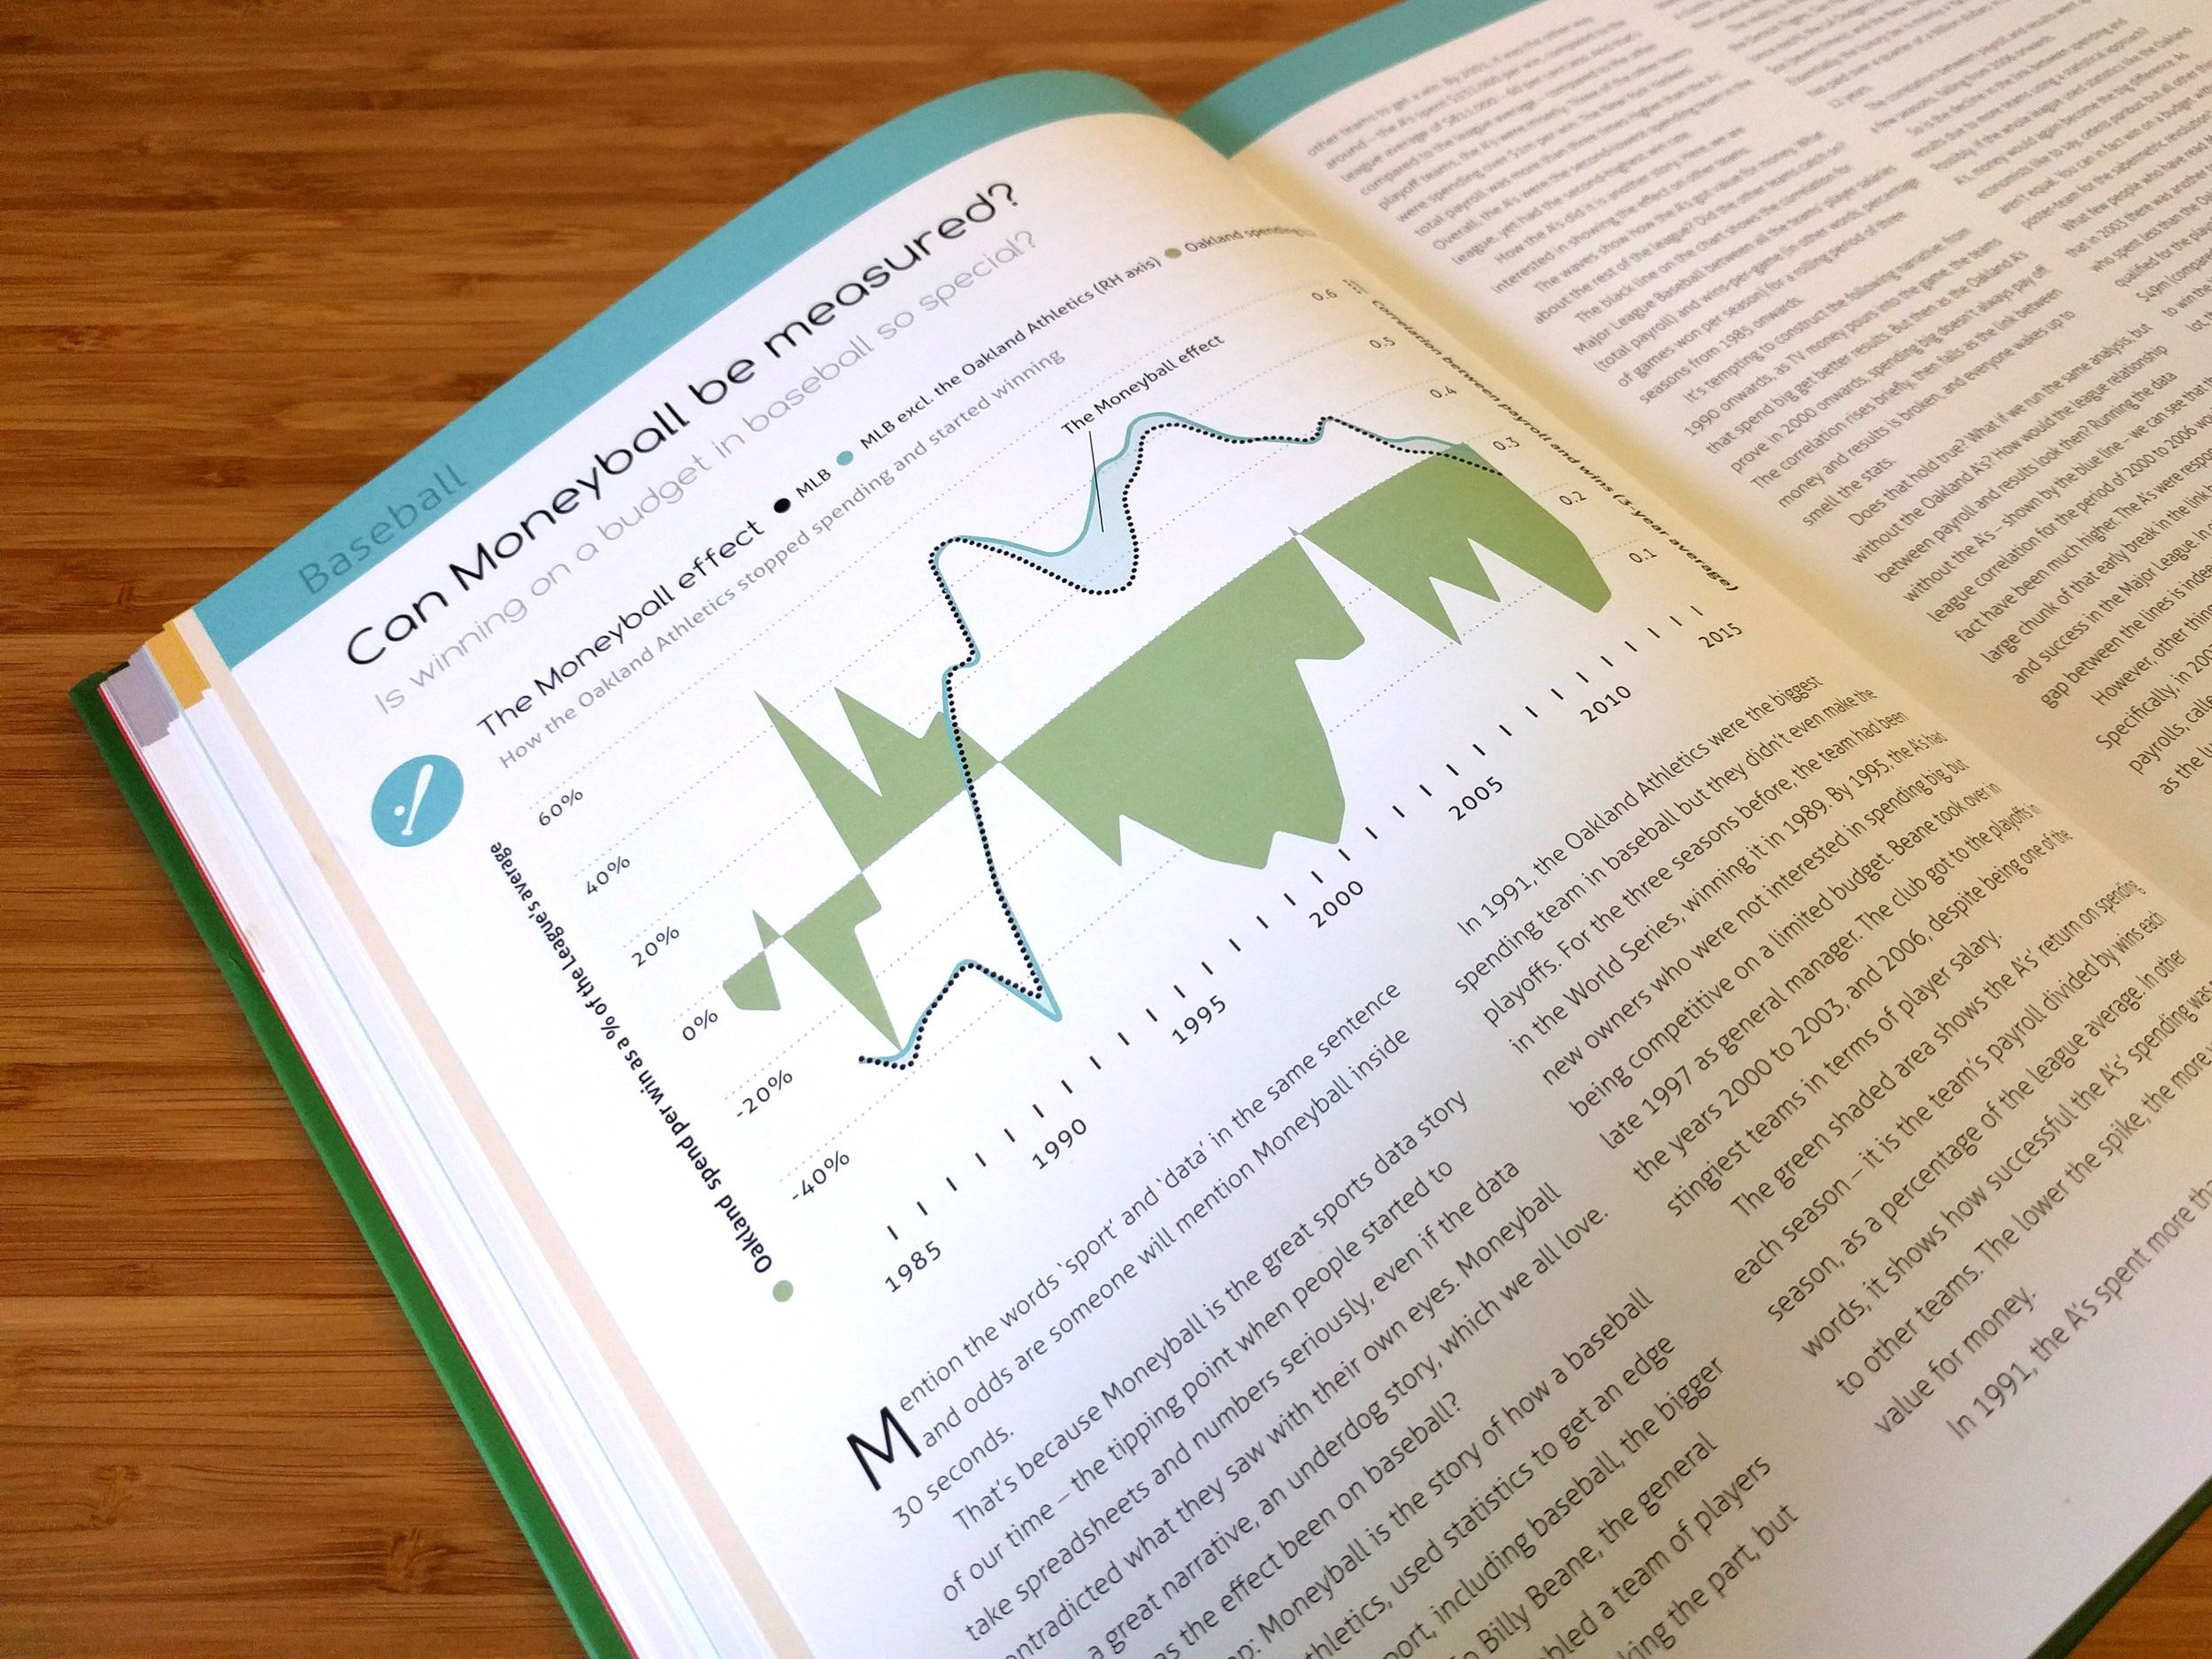

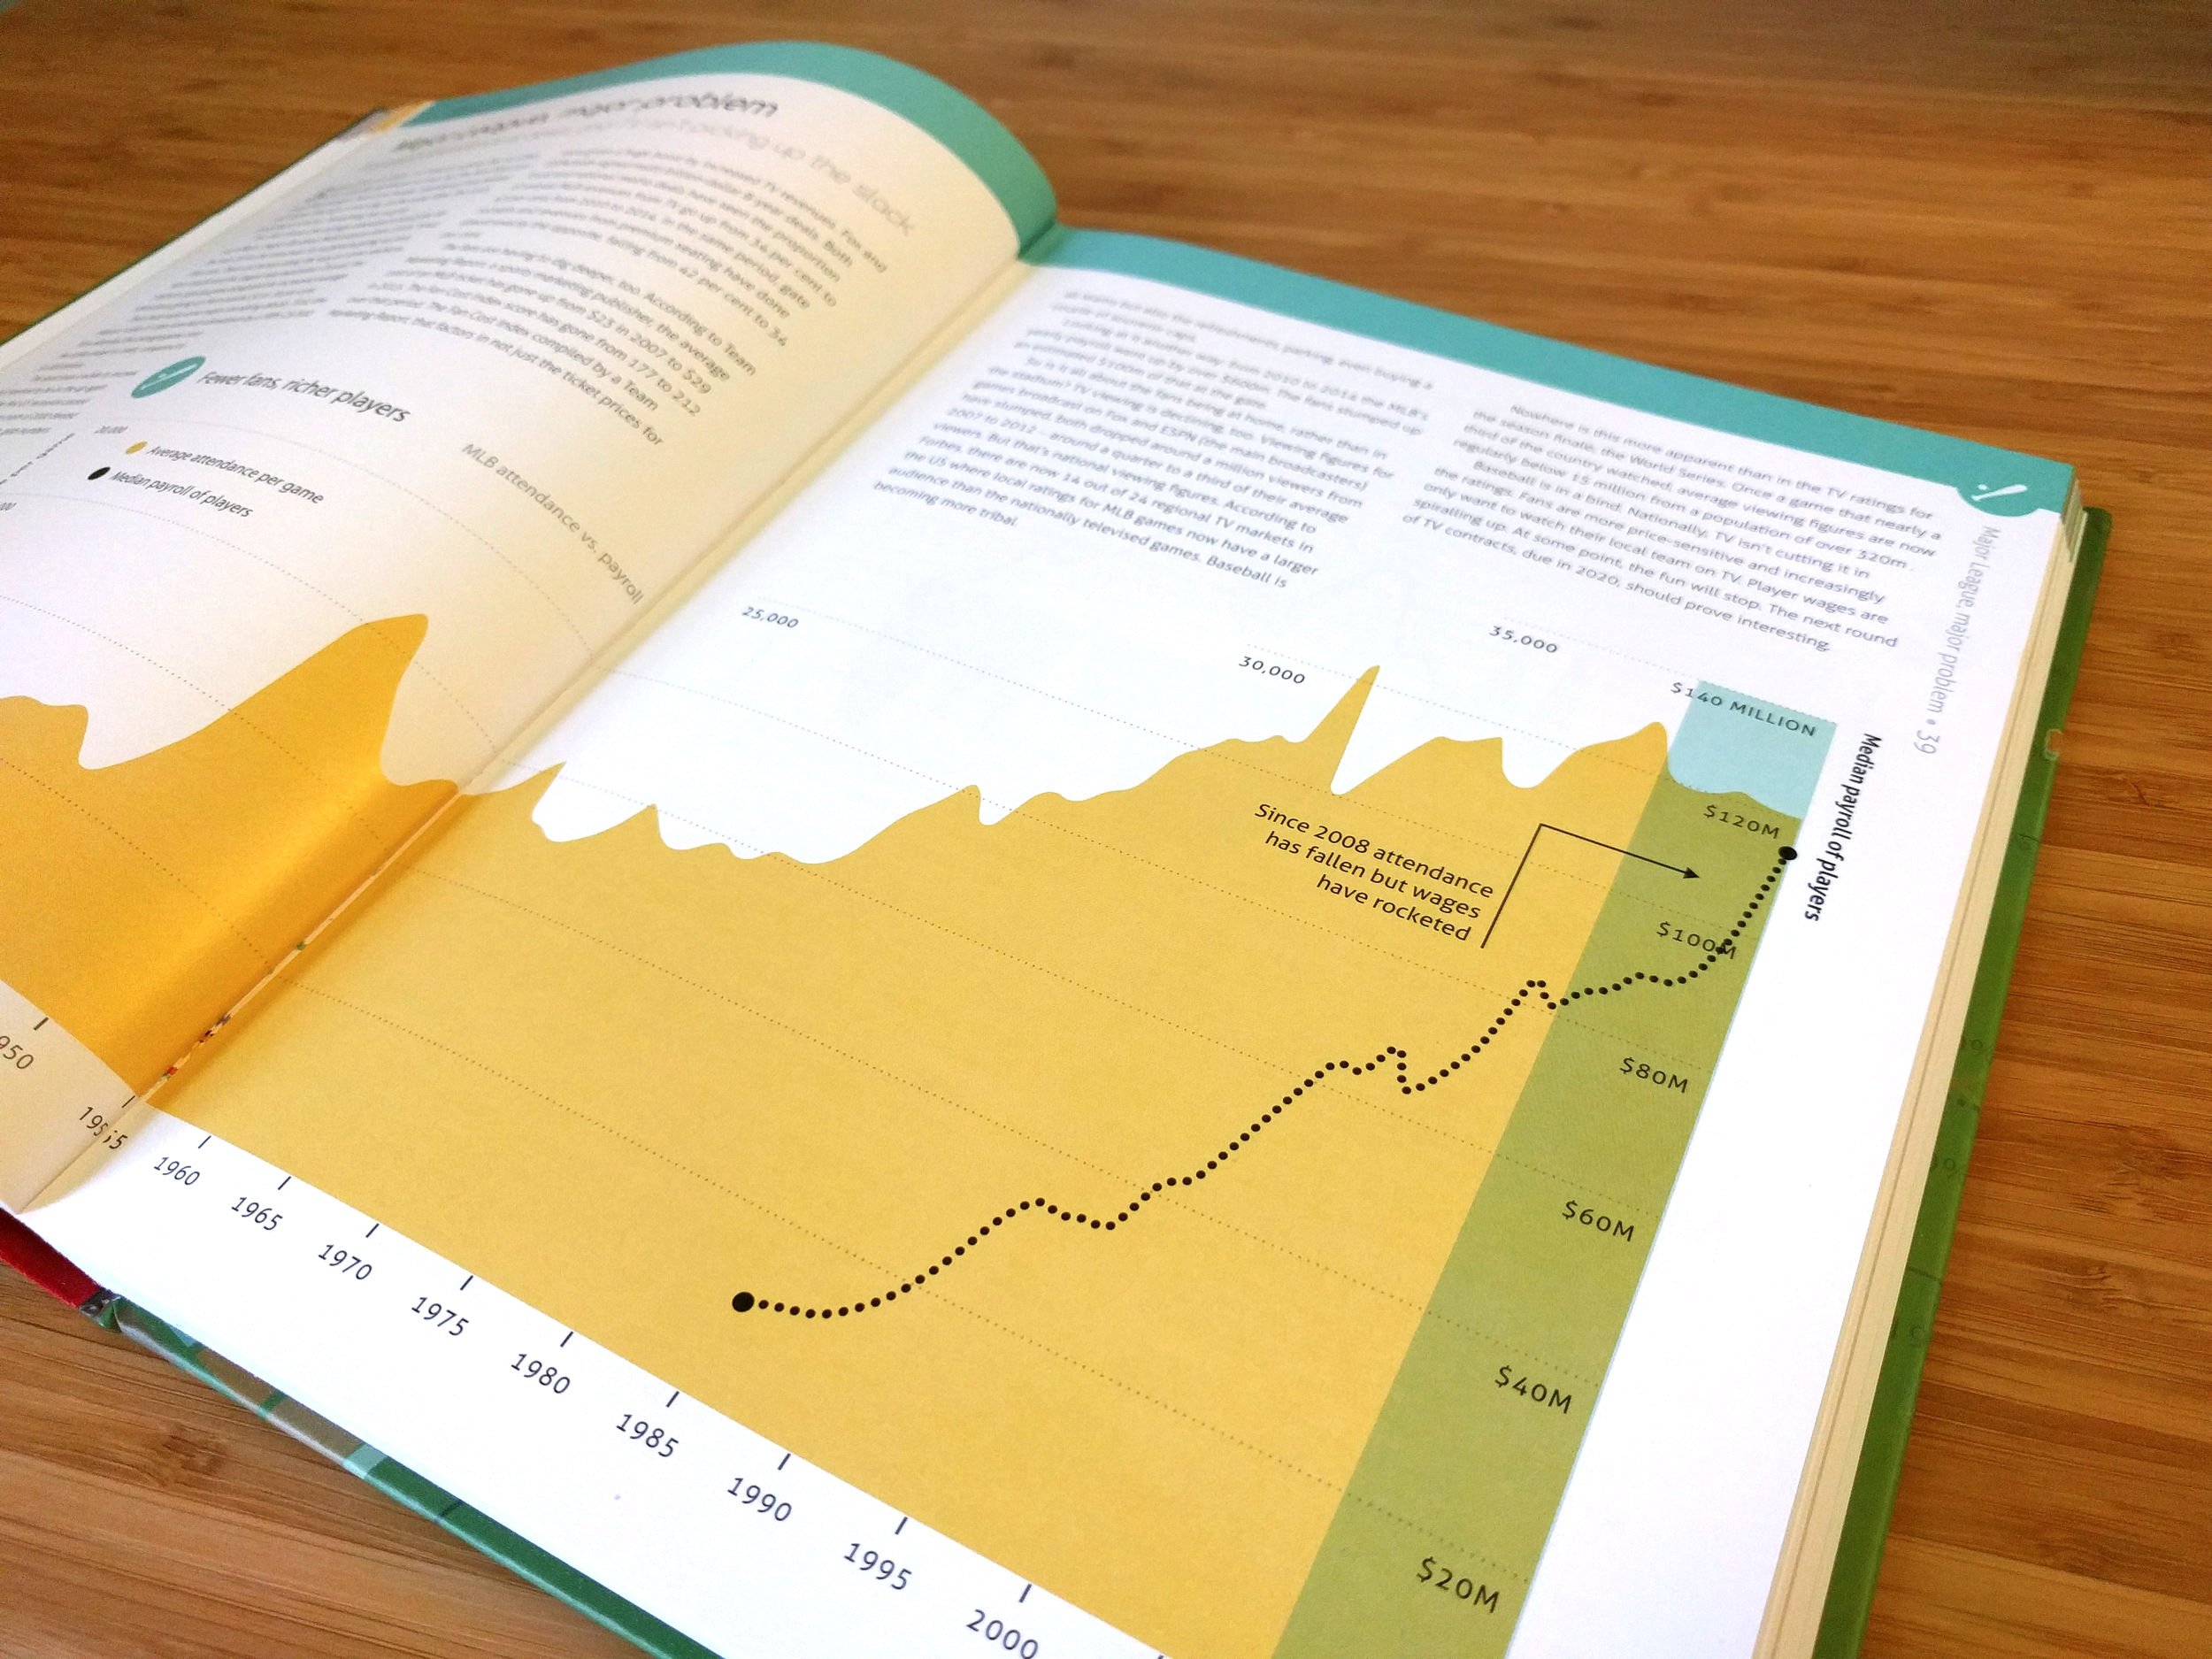
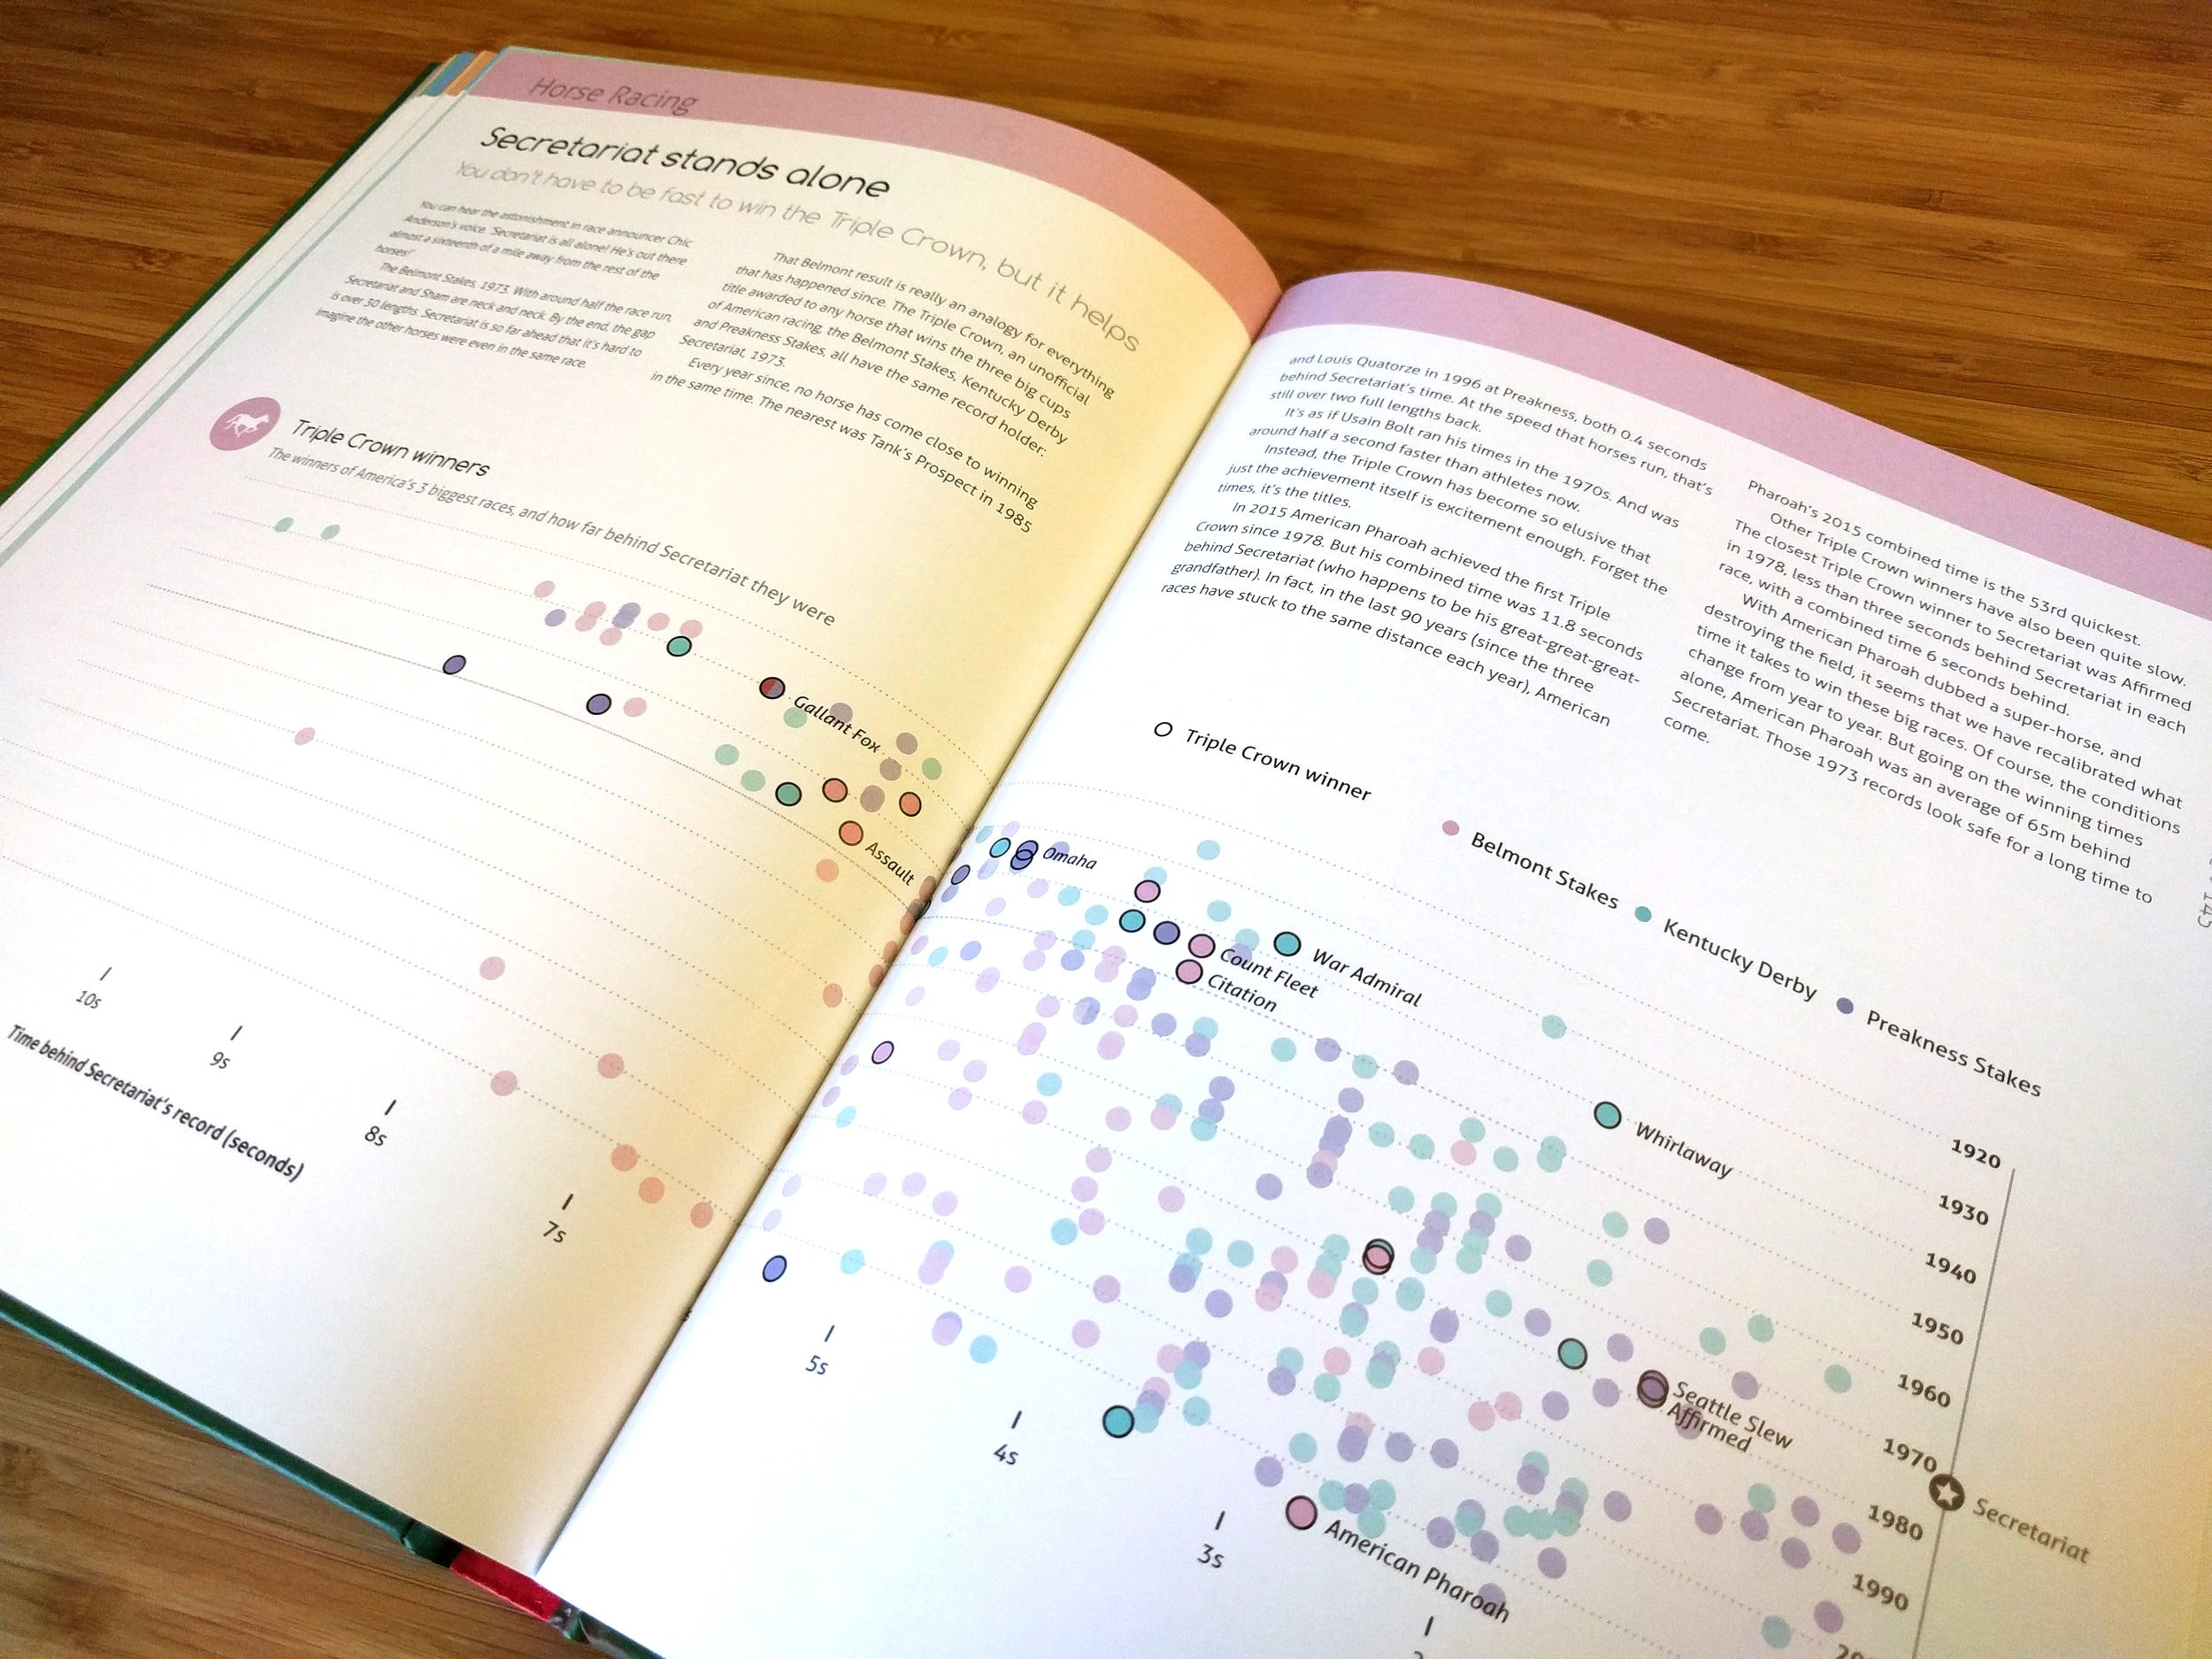
To bring the data to life, the book needed dozens of charts to visualize complex sports statistics and quantitative analysis. It was clear this was a job for experts: simple Excel charts just wouldn’t do. Having seen the breadth and wide-ranging style of graphics that Beutler Ink had created for previous clients, Bloomsbury approached us to see if we would like to partner with them to help create this striking publication.
We worked quickly to develop a series of easily readable visualizations, first creating an overall style and then using unique illustrated and color-coded icons to make each sport distinctive. To provide a variety of visuals, the team incorporated over 20 kinds of charts, from the straight line and bar charts to more complex stream graphs, alluvial diagrams, and original visualizations.
The final outcome? A compendium of more than 100 breathtaking visualizations, each of which beautifully illustrates the data and brings extensive research and analysis to life. Both Bloomsbury and the author were thrilled with the results, making this project a definite win.