
Social Content's Nine Lives: How Evergreen Content Reemerges
Content is king on the Internet, but viral empires are fleeting. Social media's insatiable desire for the newest memes and videos means that even the most LOL of #SelfieFails will eventually fade from the web's collective gaze. But sometimes—when you least expect it—content you haven't seen for ages will pop up again on your social channels like a twenty dollar bill in the laundry. Such was my experience when Cat People vs. Dog People reappeared in my Twitter feed after a two-year absence.
But I'm getting ahead of myself.
Before I talk about the triumphant re-emergence of Cat People vs. Dog People, I want to provide some context by examining the typical lifespan of social content. Statistical analysis supports the conventional wisdom that social engagement (e.g., retweets, likes, comments, and shares) for most forms of social content peaks within a few hours of posting. But not every piece of content maps with that trend line.

Like, Share, Repeat
The long term visibility of any piece of content—be it a blog entry, Vine video, or Instagram pic—is driven primarily by user engagement. When a post generates likes, shares, and retweets, it attains greater momentum as it appears on new streams before new audiences. This is especially true on Facebook, as the proprietary News Feed algorithm amplifies the reach of content with higher levels of engagement.
Conventional content marketing wisdom suggests that for a piece of content to be successful, it needs to attract eyeballs and shares within the first few days—or even hours—of posting. This is as true for personal posts as branded content. It's unlikely that anyone will stumble upon your hilarious pic from Señor Frogs three months after you uploaded it to Facebook.
R/GA's Zachary McCune has culled together some interesting statistical assessments of the "half-life" of social content. In science, half-life refers to the period of time required for a particular quantity of radioactive material to decay such that only half of the initial number of atoms remains. For the purposes of social content, it's the final mass—as a measurement of total likes, shares, and other engagement metrics—that concerns us. We want to identify the zenith of the user interaction curve after which engagement tails off and the content is no longer "fresh."

These numbers suggest that the half-life of social content is indeed nasty, brutish—and getting shorter. McCune notes that in some cases, the identified time spans are significantly smaller than similar measurements taken only months before. For instance, Bit.ly research on Twitter from June 2012 found that links had a half-life of 2.8 hours. But Moz's November 2012 study arrived at the 18-minute figure shown above. Such a change could reflect a slightly different methodology. But a similar half-life decrease was also evident on Facebook.
McCune's piece is well worth a careful read, but a large caveat is in order: while the average Facebook update might fit that thirty-minute model, there are many posts that deviate substantially from the mean. Your sister's solipsistic "feeling bored" post may attract a single "selfie" like and peak out after three minutes. In other cases, the same piece of content may garner multiple engagement spikes as it is repackaged and reprocessed through the social media content cycle.
Enter: Cat People vs. Dog People.

Between Felines And Canines
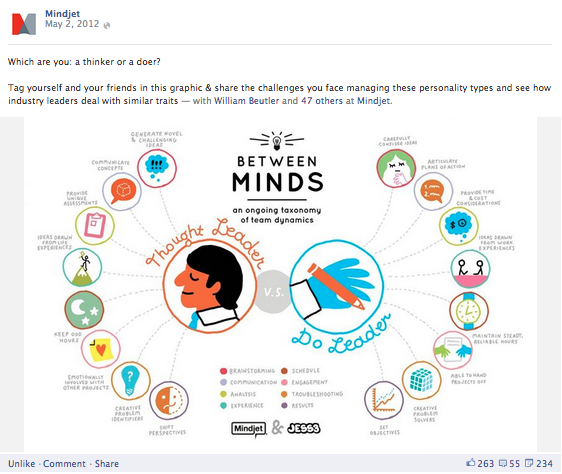
In the Spring of 2012, Beutler Ink and JESS3 worked closely with Mindjet to produce an infographic and blog series titled "Between Minds: An Ongoing Taxonomy of Team Dynamics." The series highlighted the often dichotomous personality types present within office spaces and other work environments—e.g. Thought Leader vs. Do Leader, Left Brain vs. Right Brain, and Optimists vs. Pessimists. The posts mixed playful imagery and irreverent humor with carefully researched statistics and case study examples.
One key objective of Between Minds was to drive traffic to Mindjet's blog and social channels. As such, Mindjet wisely adopted a staggered posting scheduling whereby:
A graphic would initially appear on Facebook in the evening with an invitation for readers to tag themselves and leave comments ("I'm soooooo Left Brain!").
A blog post link would follow the next morning providing further contextual detail and inviting readers to visit the website. ("Are you LIKING our new infographic series? Read more about it here…")
And finally, a follow-up graphic would be posted later in the week incorporating tagged individuals.
This approach—along with well-timed ad buys—prolonged the content's exposure and kept followers wanting more. The graphics were a natural conversation starter, as the "vs." structure encouraged reader interaction and feedback, and the opportunity to tag yourself in the graphics personalized the conversation.
By any metric, the series was a complete success. Between Minds generated a 420% increase in blog traffic, 300% increase in Facebook views, and more than 1200 total likes and 800 shares.

Still, once the series was over, it was over. Although Thought Leader vs. Do Leader and similar posts had been popular, nobody expected the graphics to pop up in Facebook feeds indefinitely. The engagement trends for the Between Minds posts were in keeping with McCune's half-life research: an initial spike of activity followed by a gradual tailing off. Nearly all of the Thought Leader vs. Do Leader comments, for instance, occurred with the first two days of posting, although a slow trickle of comments continued for about a week.
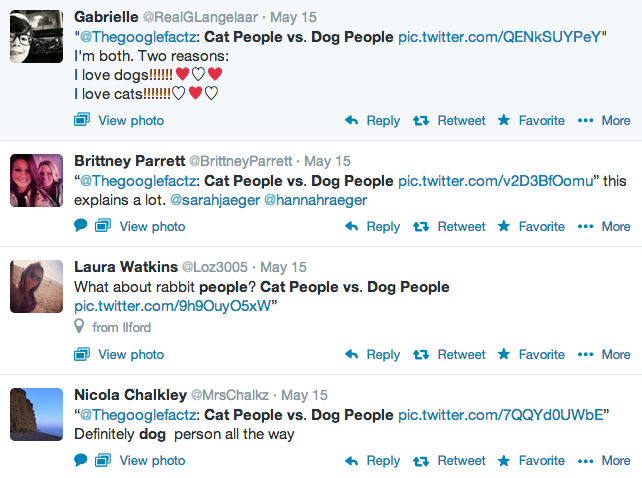
And yet two weeks ago, while scrolling through my Thai politics Twitter list, what should appear before me but Cat People vs. Dog People. One of the bloggers I follow had retweeted the image via a content spamming account called @Thegooglefactz. As surprised as I was to see Fluffy and Rover facing off again, I was even more surprised to learn that a two year-old graphic had been shared nearly 3,000 times.
While the original graphic had lived on Facebook and Mindjet's blog, this new iteration was gaining momentum on Twitter—a platform especially conducive to debate and conversation. And sure enough, Cat People vs. Dog People was again provoking a lively discussion:
But Cat People vs. Dog People wasn't confined to the Twitterverse. The graphic had been picked up by multiple blogs and Tumblrs across the globe. And like a game of telephone at a grade-school birthday party—"Henry has a pet turtle that he keeps in a fish tank" → "Henry has a pet fish that he keeps in a turtle tank" → "Henry's father got divorced after a business trip to Singapore"—the message and attribution seemed to change slightly with every new repetition. A Wordpress site called "This Made My Day" credited the graphic to Visual.ly, while a blogger named Ed Bertotti decided that the research had come from a psychologist at the University of Texas.
Old Graphic, New Tricks
Regardless of the attribution errors, I was pleased to see that a graphic we had worked on was regaining online traction. But why had Cat People vs. Dog People re-emerged two years after its initial posting? There are several explanatory factors.
First and foremost, the topic. When we first brainstormed ideas for the Between Minds series, we identified dichotomies that had traditionally stirred up a lot of debate. Something like Thought Leader vs. Do Leader spoke specifically to the business and tech communities—and succeeded because of it—but Cat People vs. Dog People had an ever broader appeal.
Because cats and dogs are by far the most popular pets, the animals and their owners are often analyzed in both scientific articles and irrevent lifestyle pieces. In journalism lingo, "cat vs. dog" is an evergreen topic—something unrelated to current events that can be revisited again and again. As such, a recyclable piece of evergreen content like Cat People vs. Dog People doesn't map with the social half-life trends identified by McCune. The original Mindjet Facebook graphic got 146 shares, but the @Thegooglefactz version received nearly 3,000 retweets some two years later.
Second, the execution. There are no shortage of cat vs. dog graphics on the internet, but Mindjet's remains more stylish and mobile-optimized than the alternatives, which tend to be either too clunky or too vertical to work on smartphones. The graphic also managed to pack in all of the relevant data points: e.g. cat people are aloof, dog people are outgoing, cat people are perceived as "open," dog people are perceived as "conscientious," etc. In short, the graphic was a self-contained, Twitter-ready conversation starter.

Third and finally, the source. The @Thegooglefactz Twitter account has a whopping 1.48 million followers. As its handle suggests, the account is difficult to categorize—one of those strange spam generators too prolific to be a human and too weird to be a bot. When I first researched @Thegooglefactz, the account title was "Google Tips." When I checked back a week later, it was "Did You Know?" Earlier today it was titled, "Psychedelic Pictures." The content in the tweets tends to change with every new iteration, but the approach seems to work.
I Can Has Parting Thoughts?
Cat People vs. Dog People seems to buck the social content half-life trends detailed by McCune and others. But, as noted above, its reappearance does reflect a repackaging of sorts by a Twitter spam account. The graphic itself has been effectively detached from the original Mindjet Facebook and blog posts—although it still carries the logo stamps of its creators (Mindjet and JESS3)—and it could easily pop up again in a similarly unattributed format via another Twitter account.


There is an obvious parallel here with image macros and similar memes which wander the internet like rōnin samurai completely untethered from their original format. Success Kid, for example, started out as a Getty Images photo of a photographer's eleven-month old son eating sand, and eventually became the internet's default "nailed it" expression.
Every new iteration of the Success Kid graphic has its own unique engagement lifespan. The version above—featuring a guest appearance from Leslie Bradshaw and our very own Lydia Wallbaum—first popped up on a blog post in May 2012, but didn't attract the internet's gaze until an Imgur posting this past February blew up.
Cat People vs. Dog People is unlikely to experience such a radical transformation unless some rogue designer tinkers with the categories or simply cuts-and-paste elements from the image into an entirely new graphic. But then, anything can happen in an Internet world where @Thegooglefactz has more followers than Estonia has people.