
BINK Labs: Television Visualizations
We admit it—we're hooked! No matter the channel (FX, HBO, BBC), no matter the platform (cable, Amazon, YouTube), no matter the genre (prestige drama, lowbrow comedy, random telenovela on Netflix), we love television! That's why so many of our in-house content projects have focused on our favorite shows (or "stories" as our grandma used to call her soaps).
The following graphics use data visualization elements and a playful illustration-style to highlight interesting (and underexplored) angles about these series and leverage fan love on social. These projects have also generated significant media coverage, from HuffPost to Fast Company to The Atlantic.
Recurring Developments
To commemorate Season Five of Arrested Development, Beutler Ink and Red Edge teamed up to completely redesign our Recurring Developments site, which visualizes the show's myriad recurring jokes—from the stair car to "Steve Holt!" to The Seaward—from every single episode.
You can see the mobile-optimized interactive visualization here.

Twin Peaks 8Bit Video Game
To celebrate Twins Peaks' 25th anniversary, Beutler Ink created a detailed illustration depicting the show as an 8-bit video game—think Legend of Zelda, Super Mario Bros 3, and Maniac Mansion—complete with dream-like imagery, portals to other worlds, and secrets hidden behind locked doors.
You can investigate the project here.

Wet Hot American Summer: Camp Stickers
Just before the debut of Wet Hot American Summer: First Day of Camp (a sequel to the cult classic original film), we released a package of camp badges that could be printed as stickers.
You can find the illustrations here, but you'll have to track down your own talking can of mixed vegetables.

A Perfectly Cromulent Infographic
Even for fans who hadn't watched the show in years, the FXX marathon of "Every Simpsons Ever" was a delight. To get in on the fun, we created a visualization that charts every episode by its main focus, whether character (like Homer or Marge) or theme (like Treehouse of Horrors or Christmas).
The full infographic can be found here.

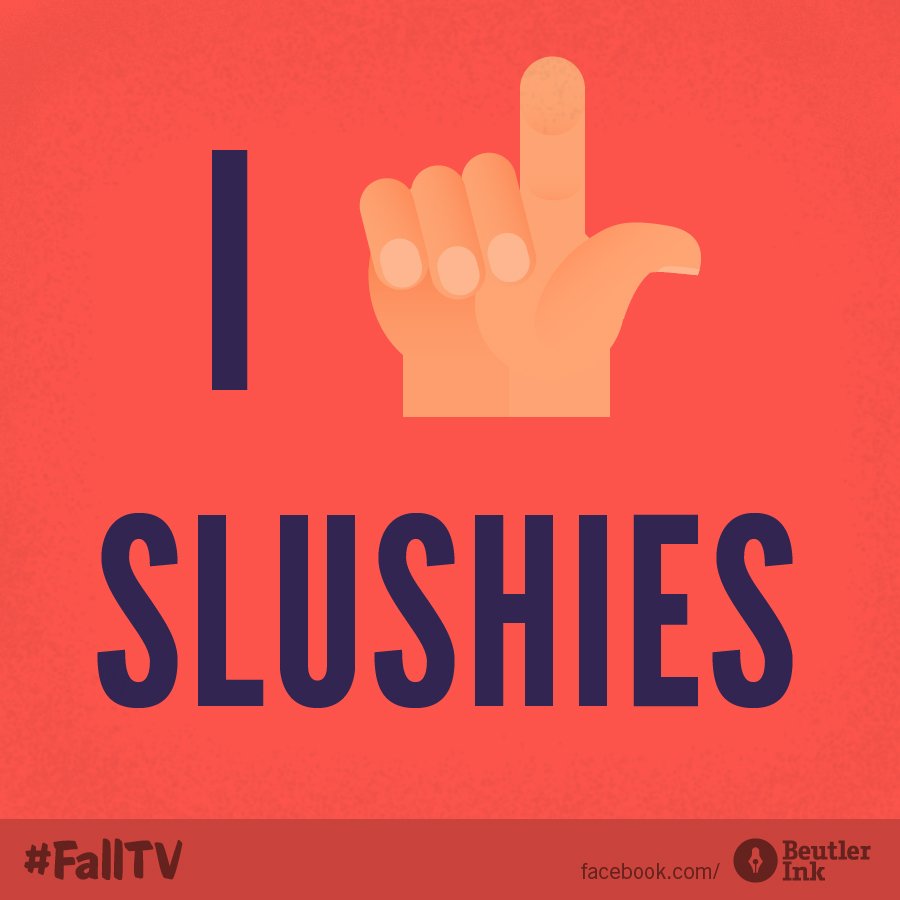
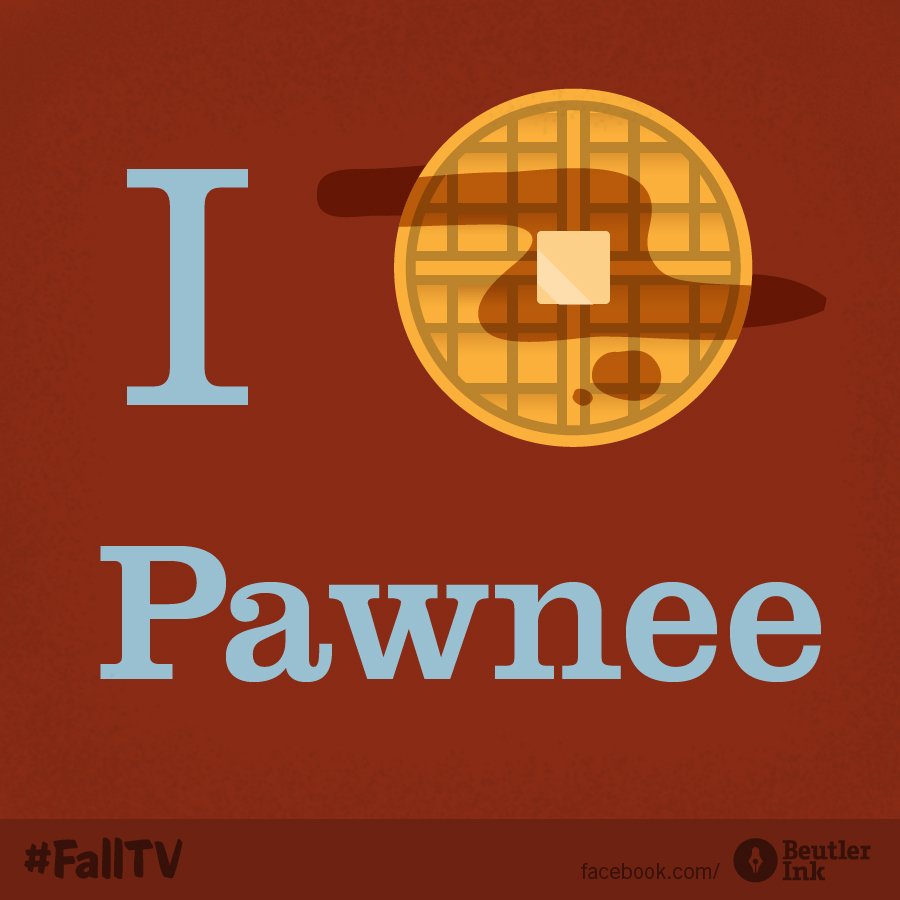
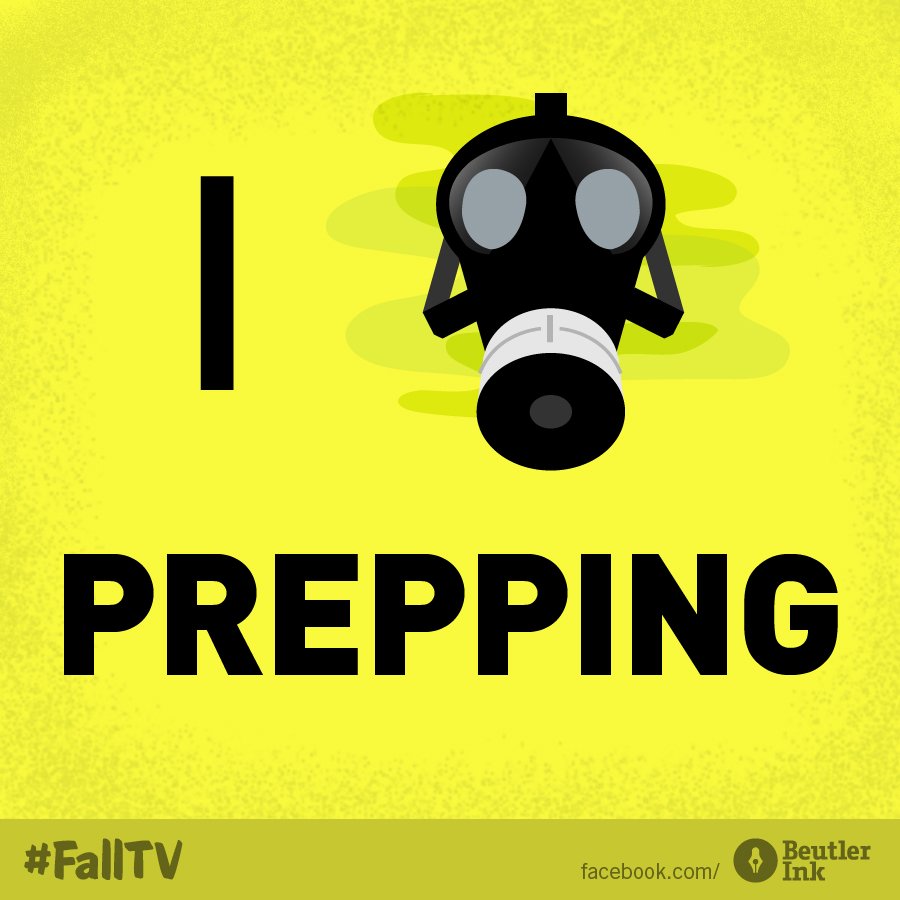
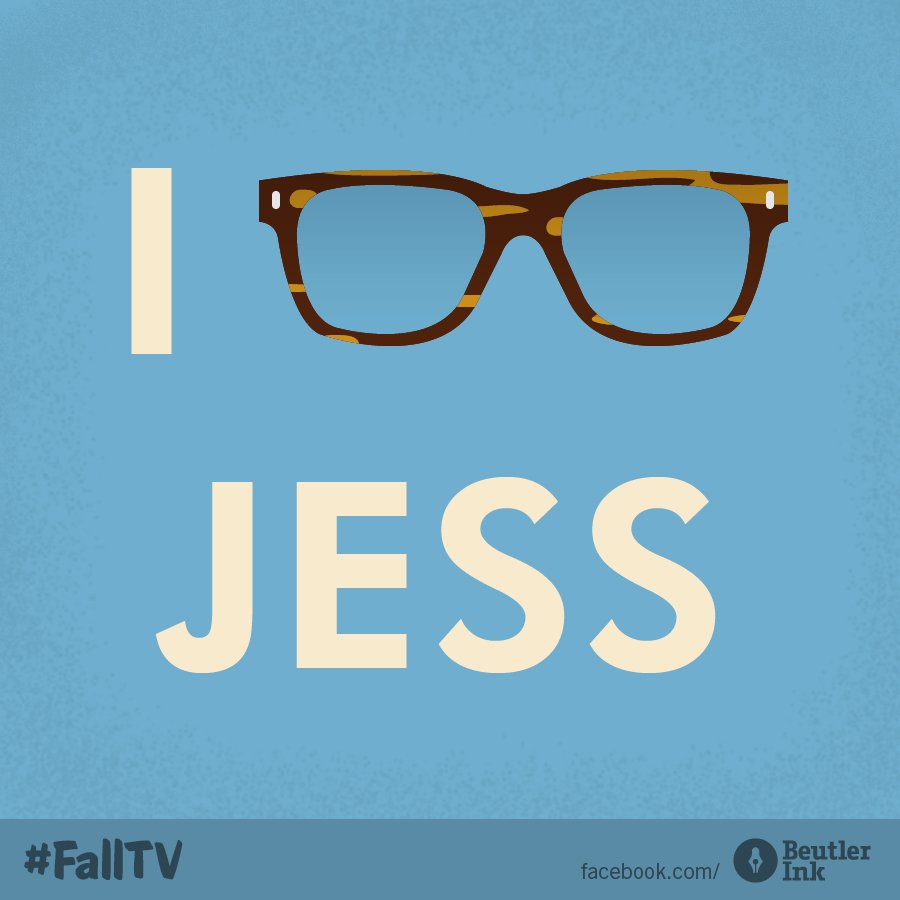
Fall TV
To celebrate our team's love of TV, we created a fun series of graphics that fans could use as profile images on social. We wanted these to be targeted at die-hard fans, and thus picked iconic—but perhaps slightly obscure—content for each show.
Click here to see them all.


Periodic Table of Breaking Bad
In the run up to the show's explosive final eight episodes, Beutler Ink released a periodic table-style treatment of Breaking Bad's characters and motifs. Hank Schrader (element symbol: Ha) is depicted with a law enforcement badge, Jesse Pinkman (J) with a chilli pepper, and Gustavo Fring (G) with a necktie.
Click here to see the entire visualization.
